FNT GraphicCenter allows you to easily visualize and analyze infrastructure and service data, making it the perfect companion to FNT’s other solutions. It is a high-performance visualization application that is fully integrated into the FNT Command platform and based on technology from yWorks – the market leader in graph and diagram visualization.
The application enables fast and efficient analysis of networks, infrastructures, services, and their relationships through graphical visualization of assets and resources. It helps recognize patterns within the data, to visualize structures, and to gain a better understanding of dependencies. Staff responsible for planning and managing infrastructure and services are thus able to make better knowledge-based decisions.
Benefits of FNT GraphicCenter
Webinar
FNT GraphicCenter 2.0: Gaining Clarity in Complex Structures with Dynamic Visualization

Highlights of FNT GraphicCenter
FNT GraphicCenter presents data and information by enabling targeted, rule-based configuration of the visual appearance of the elements. Options include defining conditions that must be met to give certain elements a specific appearance or to define membership of several elements to a group, for example. The result are visualizations that allow rapid identification of patterns, which makes evaluation and analysis of data far easier.
Having created a view of a selected object within its network, you can then modify that view depending on the network structure and type. Thanks to automated creation of the layout, it is possible to switch the basic view between orthogonal, symmetrical, hierarchical, and circular modes.
To make relationships more visible, individual objects can be viewed either in an overview or in detail. The user can zoom in and out of the view or even center the view on the object to be analyzed. The automated visualization function then displays all logical connections associated with this object. Among other features, a distinction is made between direct and indirect connections to show all dependencies in their overall context.
Easy data availability makes it possible to implement visualizations for a broad range of applications to meet individual user needs. If data from the FNT Command platform is used, it can be flexibly selected. Since it only needs to be configured once for each data source, powerful yet simple, rule-based automation of duplicate identification and removal and other functions make it possible to process raw data quickly and efficiently.
Yes, I want to visualize and analyze my infrastructure and service data easily.
Use Cases
FNT’s solutions address a variety of market sectors in the fields of telecoms, data centers, and enterprise IT. Typical use cases for FNT GraphicCenter in these sectors and contexts include:
- Telco network and service topology
- Telco service routing and configuration
- Outside plant cable network infrastructure
- Inside plant cable network infrastructure
- Data center infrastructure circuit diagram
- IT application infrastructure
- IT network infrastructure
FNT GraphicCenter comes standard with a range of out-of- the-box configurations for visualizations. Users can use these as is, as a basis to create their own configurations, or build new ones from scratch for specific tasks.

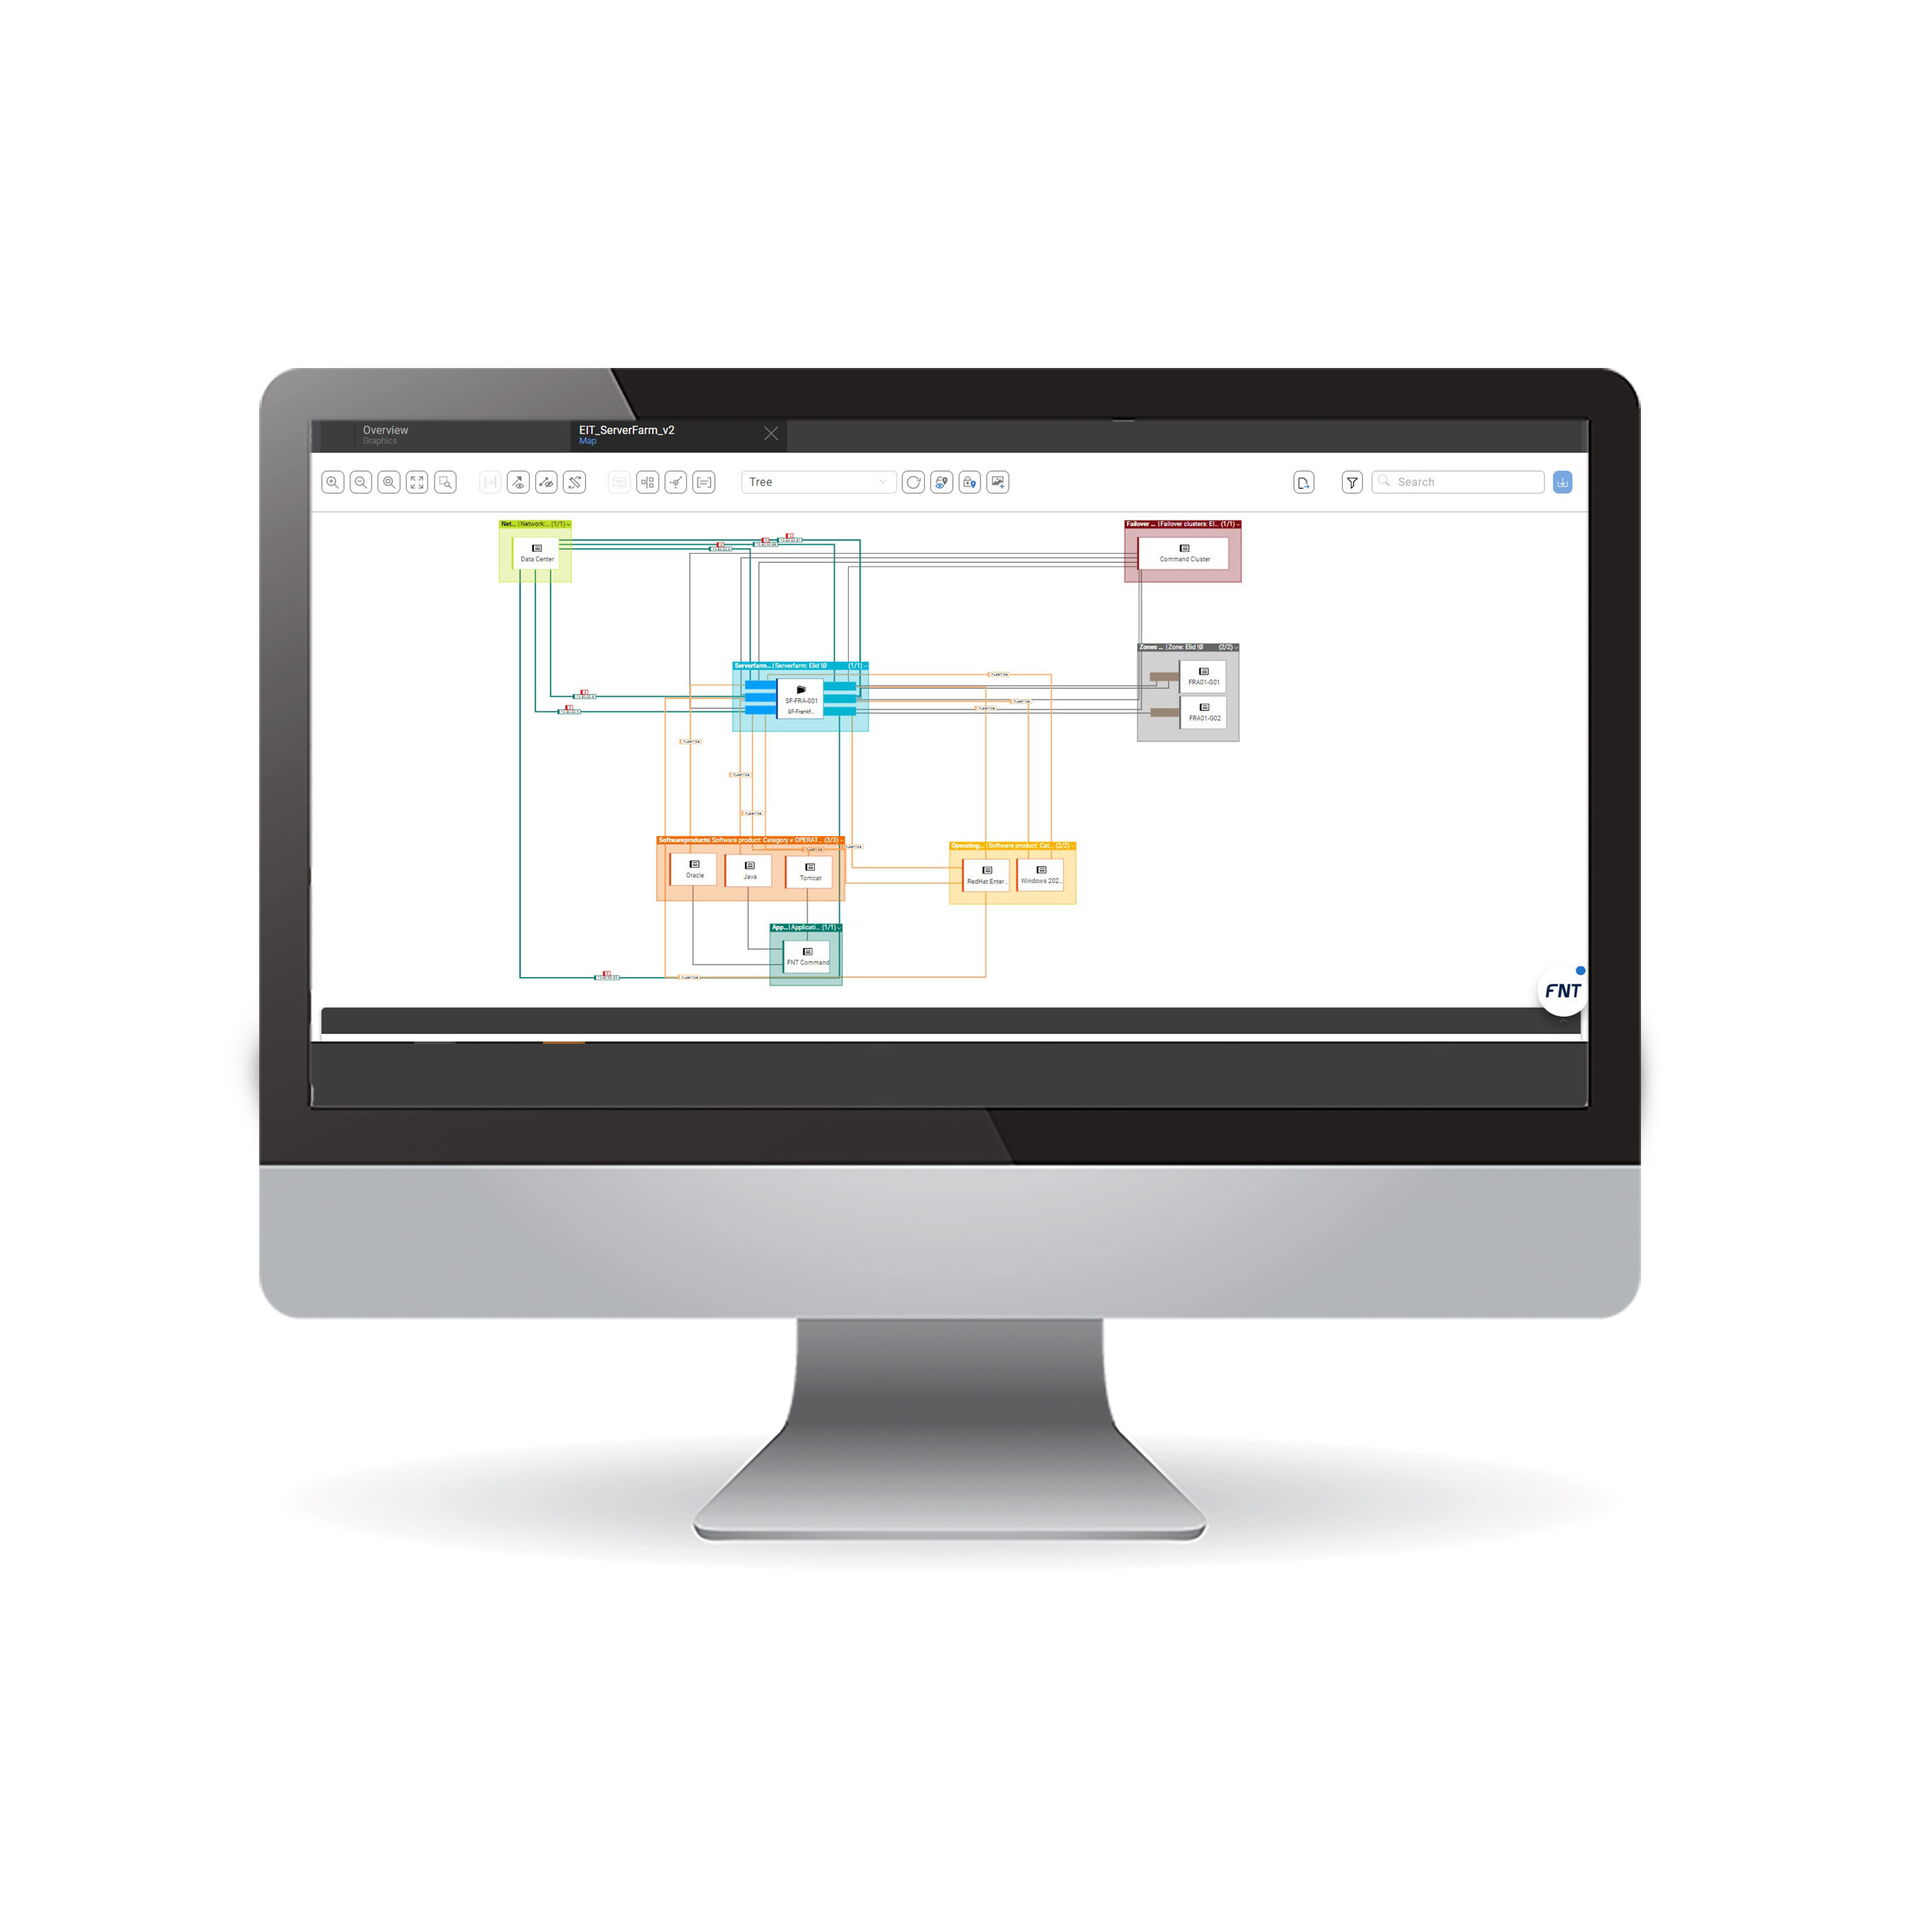
IT Application Infrastructure
Challenge
Understanding which assets are linked to operation of an application.
Solution
Visualization from the application through virtual servers to physical servers, together with all the assets associated with that application, e.g., application servers, middleware, OS, and databases.
FNT GraphicCenter can display all the assets linked to an application, with visualization making it easy to identify:
- which assets are used for operation of a specific application
- when is the best time to plan maintenance work on assets, such as servers, to ensure compliance with the SLA
- where a specific operating system is used, so as to be able to estimate the effort and the applications affected when the manufacturer announces an update
- which applications are running on a specific server, making it possible to estimate whether it could support additional applications
- the services that include a specific application, if additional data has been collected as part of service asset management

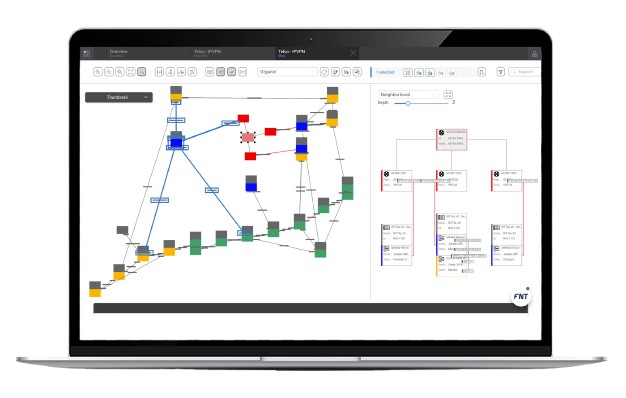
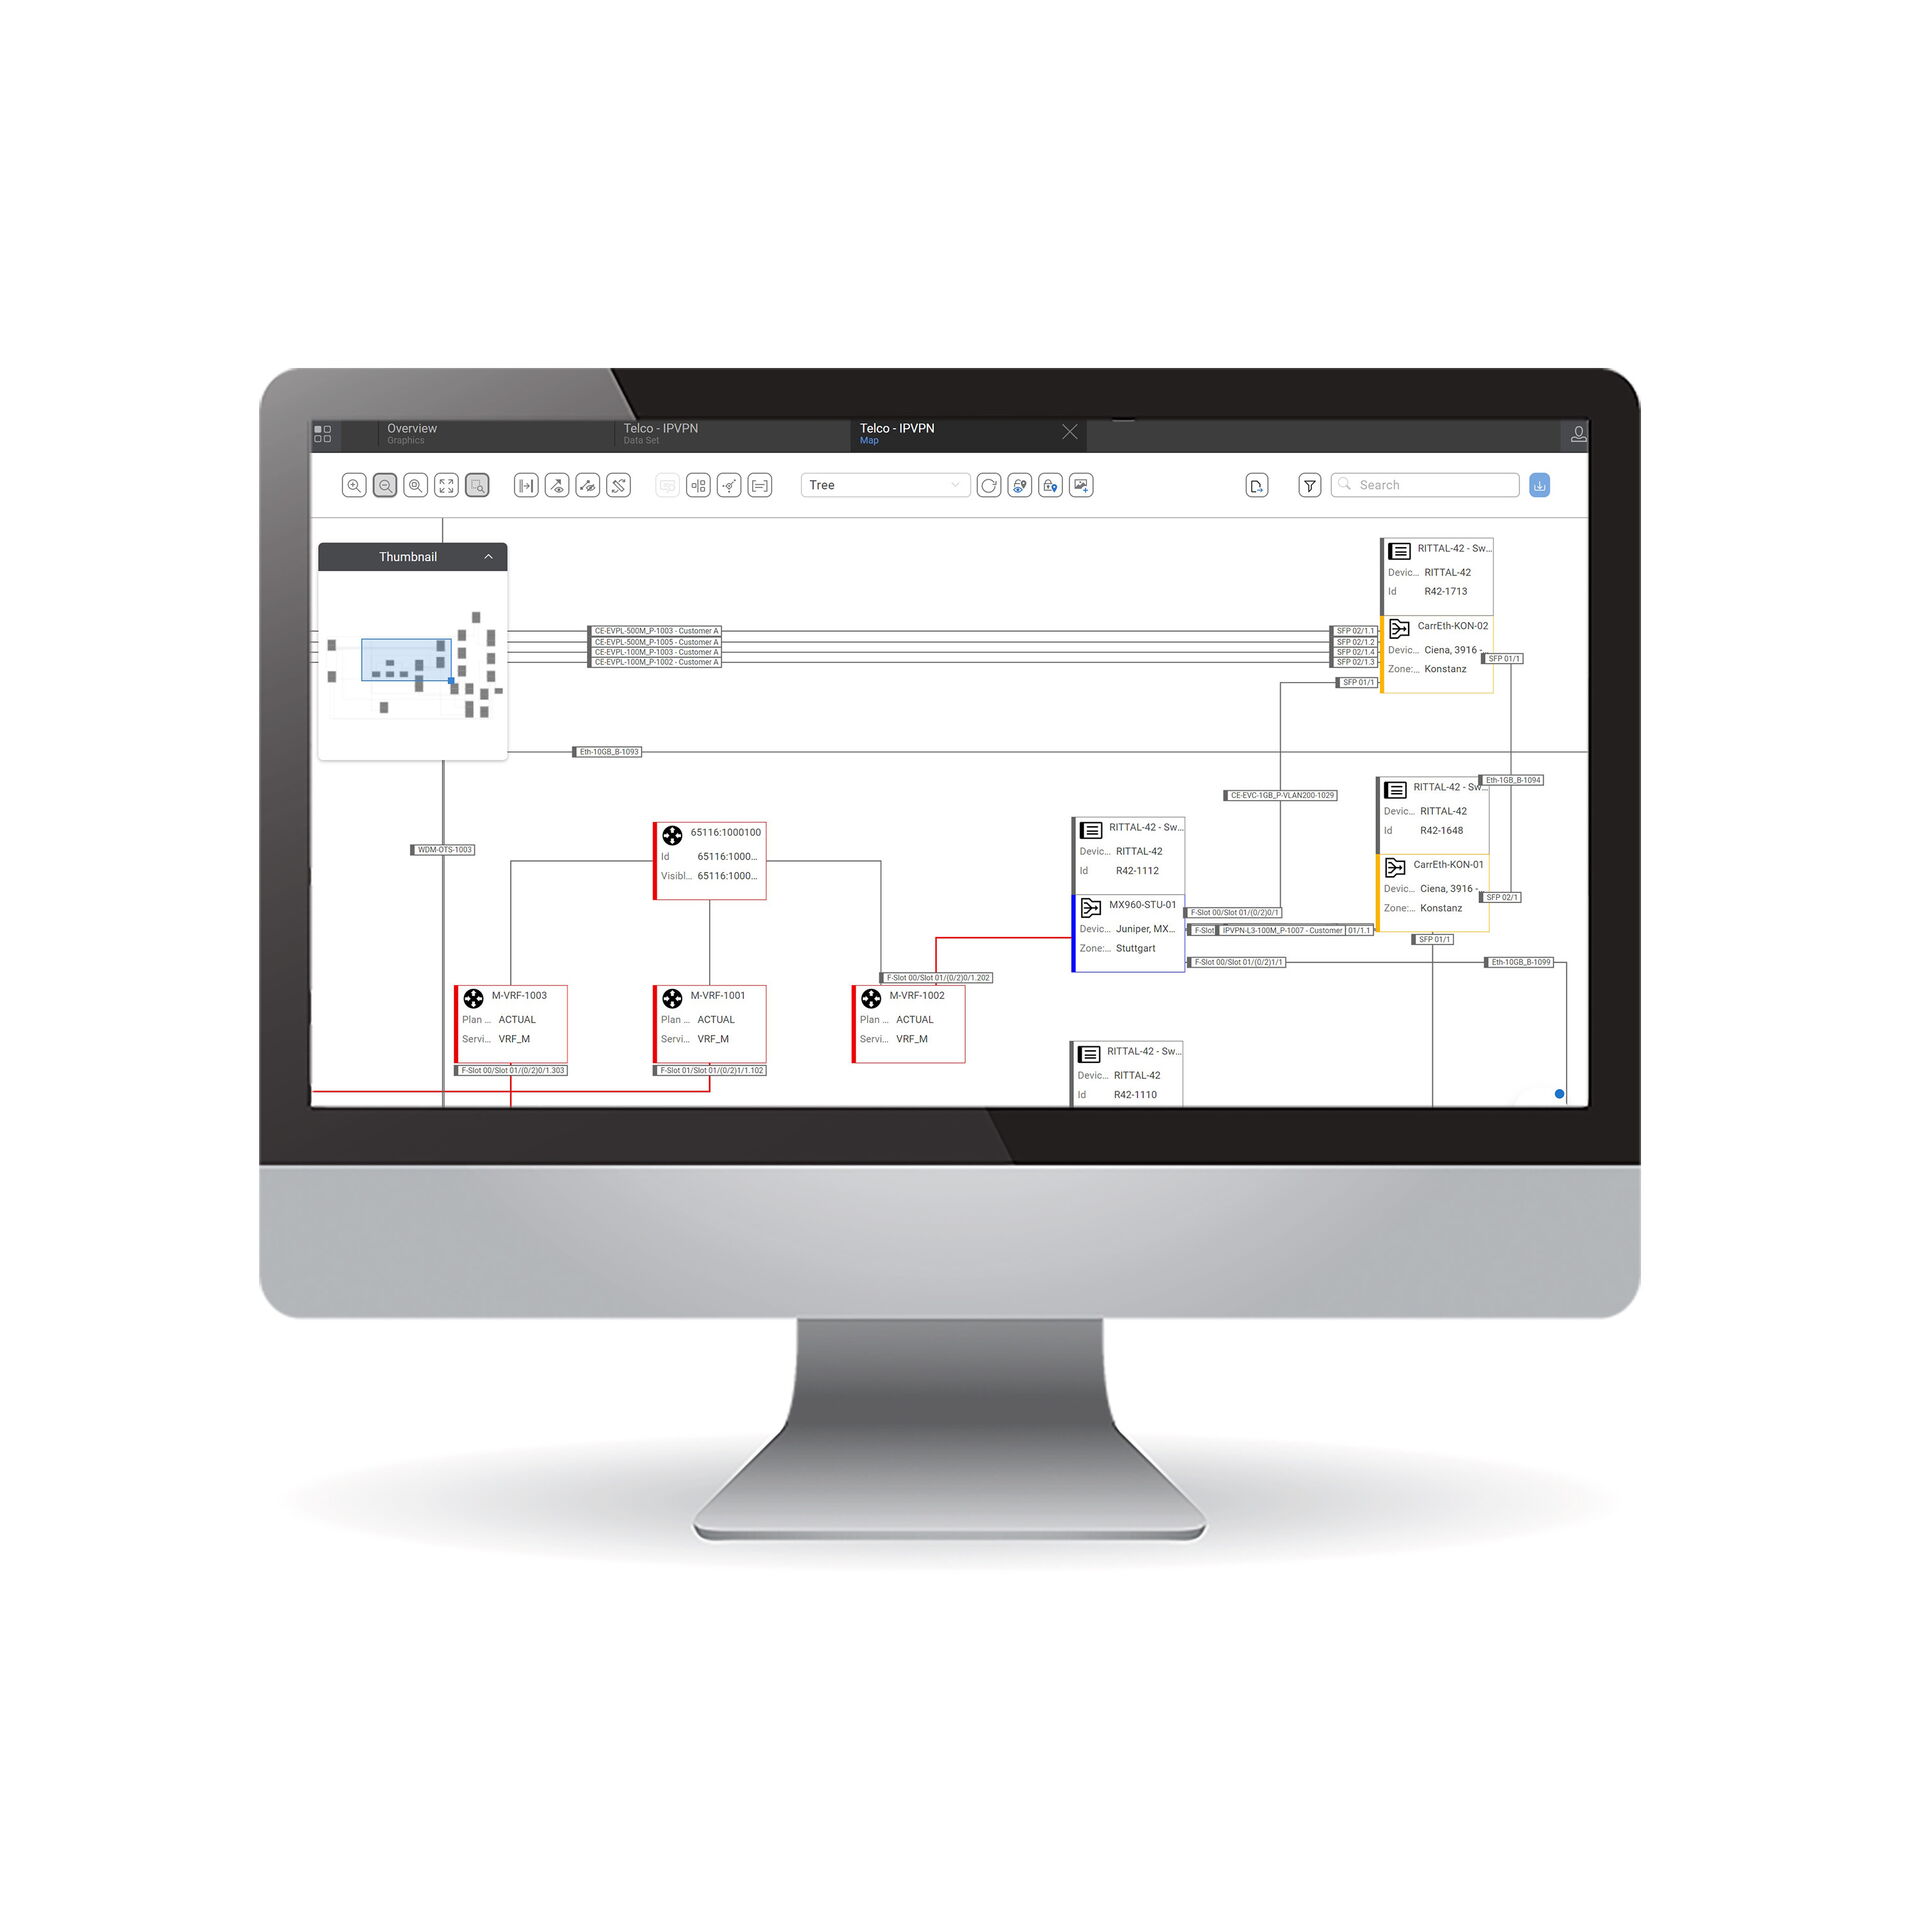
Telco Network and Service Topology
Challenge
Network complexity increases exponentially with the number of nodes. Typically, these networks also consist of a variety of technologies, hierarchically connected to one another in different layers. Maintaining an overview of the relationships and dependencies is essential for efficient network operation, planning of network expansions and redesigns, and for creating new connections through these networks.
Solution
Visualization of network nodes and the different connections between them according to the individual network technology, together with all the important associated parameters. Flexible filter options and categorizations allow visual depiction of these complex dependencies and provide the user with targeted analysis options for different use cases.
FNT GraphicCenter makes it possible to display all the relevant elements of a network, from physical network nodes and logical connections through to the service level. Visualization helps to:
- provide a better overview
- identify dependencies and relationships quickly in the event of a fault and draw conclusions about possible causes
- immediately identify the various segments or technological layers of a network thanks to the different colors allocated to objects and their connections
- provide a rapid overview of the characteristics of services, such as bandwidth, using specific colors
- facilitate tasks, such as identifying possible redundancy options to boost network resilience in order to ensure the best possible quality and availability of services
Would you like to know more about cable management? Then you might be interested in the following:


Our products:
-
FNT CommandManage your IT and telecommunications infrastructure
-
FNT SustainabilityReduce your carbon footprint
-
FNT CommandMobileAccess the FNT Command Platform from any location and at any time
-
FNT Infrastructure Health & MonitoringEstablish the foundation of a resilient digital infrastructure
-
FNT AnalyticsBusiness Intelligence module for smart evaluations and analysis
-
FNT ProcessCenterManage infrastructure provisioning and change processes more efficiently
-
FNT IntegrationCenterSimplify, speed up, and lower the cost of software integrations
-
FNT EventEngineMonitor events and trigger targeted actions
-
FNT ServicePlanetTurn your IT into a key success factor
-
FNT StagingAreaSimplify data exchange between your systems
-
FNT GeoMapsImprove network management with location-based visualization and analysis of resource data
-
FNT ValuePackThe fastest way to reach your objectives
-
FNT GraphicCenterVisualize and analyze infrastructure and service data


